
The moving bar
When absolute progress becomes relative decline


Most performance evaluation frameworks for end of year rewards contemplate a performance goal expressed as % of the target reward (bonus, RSUs). At expectation is 100%, above expectation is 110% or more, below expectations is 90% or less and so on. If someone goes into 140% territory they can be promo material, if they flirt with 60% they are at PIP risk.
I had one person in the team, a data analyst, who was “subscribed” to 80%. For two cycles in a row, the number came out below expectations. Not a performance problem, but never at par with other DAs at similar levels. He joined my org because his previous team was disbanded. He landed with us carrying a level our own hiring bar would never have handed him. Once a level is set, you cannot take it back because it was a “forced” transfer, not an application to an open role. So he started already stretched, with a business title that his output did not quite reach.
He was a very specialized profile. His previous team ran in a very “Taylorian” way. They had one person just to keep the Kanban board groomed, another person just for one integration tool etc. This analyst was very deep on analysis and insight, also in a very service desk way with limited contact with stakeholders, and thin on everything else.
I made a plan to expand his scope and make him more full stack: some dashboarding, some analytics engineering. In the first year he made some initial progress, and then in the second he visibly expanded in those two directions, but finished below the bar anyway, because the bar moved.
A lot of discussions about AI and productivity usually consider the average worker or the aggregate effect. Many studies proved that AI is lifting the low performers, with the largest productivity gains accrued to the least-skilled workers on bounded, clear-ground-truth tasks. However, for performance calibration and expectations, I’m realizing that the variance and the p99 are having a bigger impact.
For example, this post by Pragmatic Engineer with Cursor data
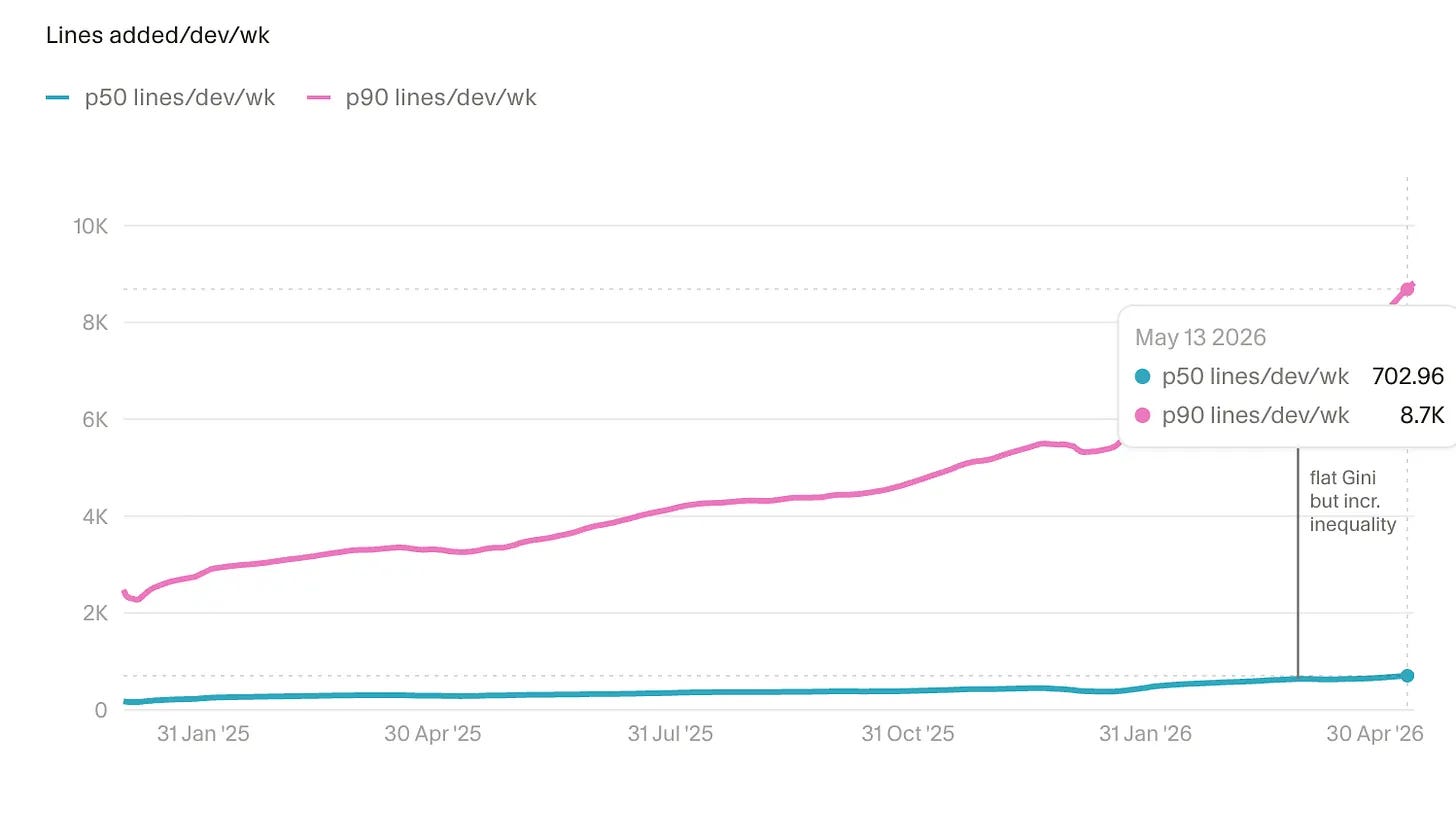
shows how the median developer ships about 700 lines of AI-assisted code a week, while the p90 ships nine thousand and p99 ships thirty to forty thousand, which Cursor helpfully converts for us into the weekly output of roughly 45 median developers. One person = 45 headcount of code. This doesn’t mean that the top 1% ships 45x the value (maybe it’s 45x the bugs), but it’s a data point that is hard to ignore.
This range of variance in productivity metrics (or pseudo-productivity) is much wider than the performance evaluation framework. There is no 45x bonus available. The p99 will get above expectations, but it will still be a 140% or maybe a 160%, 200% max. However, the p99 will make everybody else look below expectations by raising what’s expected now.
This is what happened with my DA. The first thing that moved beneath him was the bar. The people already fluent with dbt started shipping pipelines faster. The analytics engineers churned out silver-layer models at a pace that was a quarter’s work last year. Insights that took days came back to the business in an afternoon. The team median that defines expectations climbed. And even though he climbed too, acting upon the plan, the bar climbed faster. He ended the cycle still below expectations while being better than he started it. Absolute progress, but relative decline.
The second thing that moved is that the one thing he was actually good at is the thing AI accelerated the most (I wrote about it here). His specialty was analysis and insight, and generating an insight from a business question is now much faster.
I felt really bad going into the performance evaluation because this person did everything I asked and improved exactly along the directions we agreed, and still finished below a bar that moved under his feet.
Do you like this post? Of course you do. Share it on Twitter/X, LinkedIn and HackerNews